CGD Help: JBrowse
Contents
The JBrowse genome browser allows CGD users to view and explore datasets from
large-scale genomics experiments. Developed by the Generic Model Organism Database
project (GMOD),
JBrowse is a widely used application that is fast, intuitive, and compatible with
most web browsers. JBrowse allows users to quickly view large-scale sequence
data in a genomic context, at multiple zoom-levels of resolution, from base
pairs in individual sequence reads to read-density summaries across large
genomic regions. The display also includes parallel tracks of annotated sequence
features, with links to the corresponding CGD Locus Summary Pages.
Quantitative tracks graphically display comparative information, such as relative
expression level or sequence conservation. JBrowse also allows users to
load their own datasets and analysis tracks,
for display in the context of genomic features, or for comparison with datasets
and tracks provided by CGD.
For additional information and help with JBrowse see:
Please note that the two haplotypes of C. albicans SC5314 Assembly 22 are displayed
separately, and that high-throughput sequence data have been aligned by CGD to each haplotype separately.
This is primarily to reduce alignment errors for short-read sequences, but also allows sequence variation
to be viewed in the context of each haplotype.
-
JBrowse can be launched from any CGD feature's Locus Summary Page by clicking on the
JBrowse logo about halfway down the page:

The JBrowse window will be centered upon that feature.
-
Alternately, mouse-over "JBrowse" on the top menu bar of any CGD page, then select and click your
organism of interest in the drop-down menu. The browser window will be centered on an arbitrary location
of the genome.
The top menu bar has 4 items:
- JBrowse, shows version information with links to GMOD
- File, load data and customize tracks, as described below
- View, highlight features of interest, or resize quantitative data tracks
- Help, display version information and general browser help
Beneath the top menu are the navigation controls. The arrow and magnification buttons allow panning and zooming
of the display. The chromosome pull-down menu to the right of the buttons changes the chromosome displayed.
The box to the right of that displays the current location, but can also be used to search by location or
feature name simply by clicking and entering text. Please note that best search results will be obtained
by entering the systematic name of the target feature.
Just above the buttons and search box is a linear representation of the current chromosome, with a draggable
red box over the current location. The current location can be changed by clicking and dragging the red box.
The size of the box -- and of the corresponding region displayed -- can also be changed by clicking on and
moving either side of the box.
The main browser window displays data tracks of various types. In the far left of each track is a label with the track name,
and a pull-down menu with technical information about the track. The position of a track can be changed by clicking on
the track label and dragging it up or down to the desired position in the window.
The main types of tracks are:
-
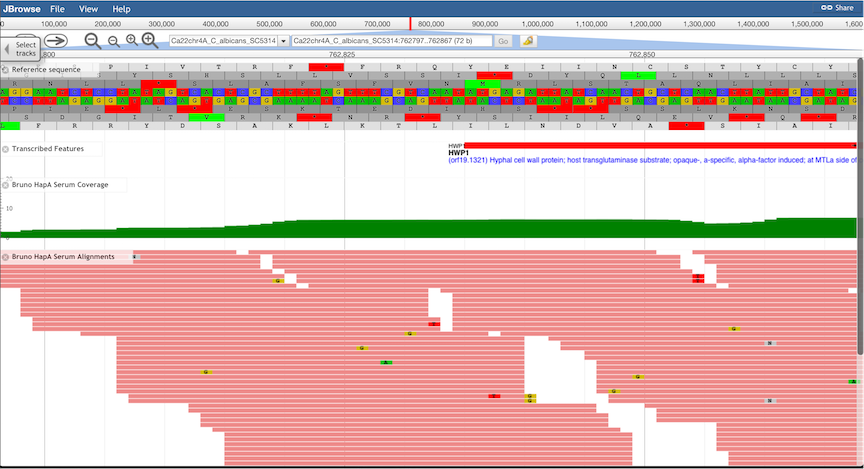
Sequence Tracks.
Nucleotide sequence of both strands, as well as 6-frame translated amino acid sequences are shown.
Note that the window may need to be zoomed-in considerably for sequence tracks to be displayed:
-
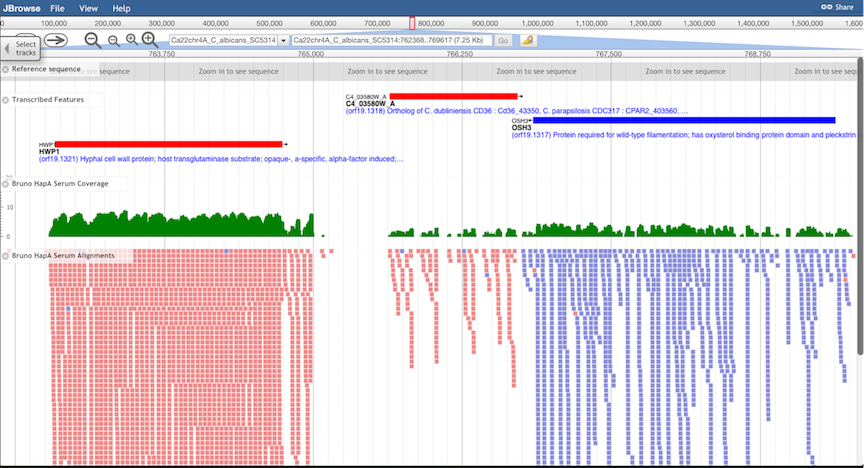
Feature Tracks.
All transcribed features annotated at CGD are displayed in Feature Tracks. Features encoded on
the "W" strand are displayed in red, and features on the "C" strand in blue. Clicking on features brings
up an information window, and clicking on the feature name in the window opens the CGD Locus Summary
Page for that feature.
-
Alignment Tracks.
Genomic alignments of high-throughput sequence data from a variety of experiment types can be displayed:
DNA-Seq, RNA-Seq, ChIP-Seq, etc. Note that the window may need to be zoomed in to view alignments, and that
scrolling may be necessary to view all the aligned reads. Also note that browser speed and performance may
be affected if more than one alignment track is displayed. For each alignment, CGD also provides two
quantitative tracks, summarizing read coverage and read density. These may be preferred if more than one
dataset are to be viewed or compared.
-
Quantitative Tracks.
Various types of quantitative data may be displayed, for example the number or density of aligned reads,
expression levels, or degree of conservation (see below). Quantitative data can be displayed on either
log scale (default for expression data) or linear scale (default for conservation scores). This can be
changed by the user in the information pull-down menu at the far left of the track.
-
Conservation Tracks.
Evolutionary conservation of genomic features is shown in four quantitative tracks, representing increasing levels
of evolutionary diversity:
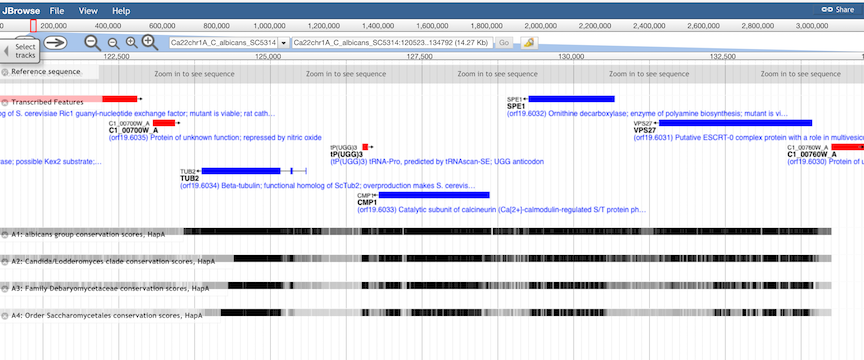
In general, the top level (derived from an alignment of 3 closely related species)
will show the highest levels of conservation, including intergenic regions, while the lowest level (derived from an
alignment of 12 distantly-related budding yeasts) will show the least conservation, and include only the most
highly-conserved genes and features. Exceptions are generally due to low information in the underlying alignments,
such as the absence of a homologous region in a closely related species.
Conservation scores were produced with the phyloP program
(Siepel et al, 2005),
based on alignments produced by the program TBA
(Blanchette et al, 2004).
Conservation scores and their underlying alignments and phylogenetic models are available for download
in the CGD downloads directory.
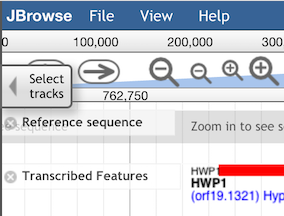
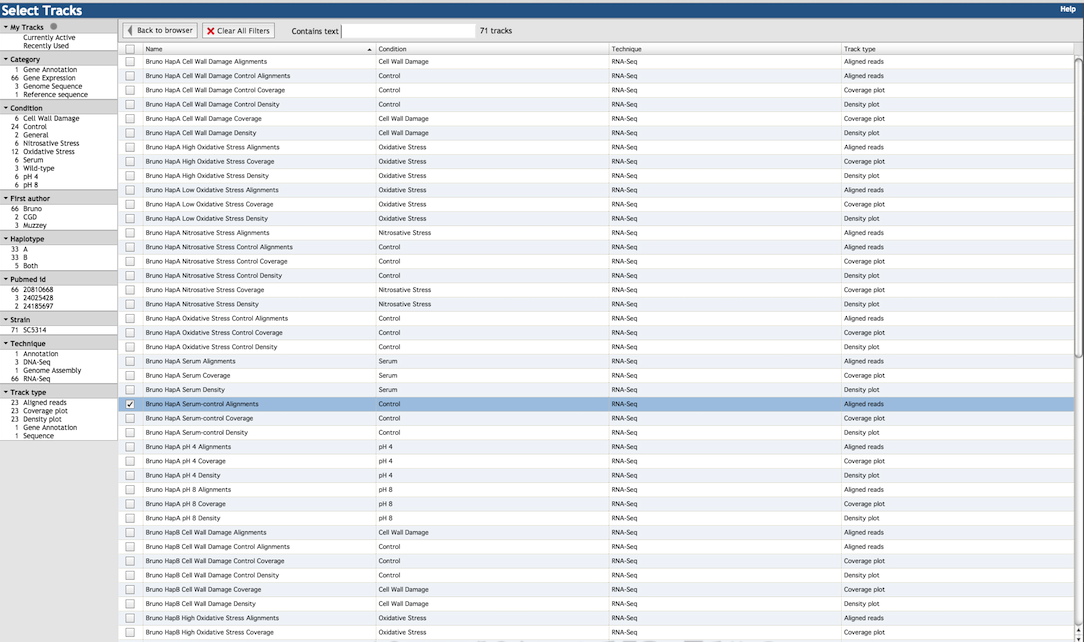
To choose which tracks to display, click on the "Select Tracks" tab on the upper-left side of the
main JBrowse window to bring up the selection menu:
The many tracks available are listed in the right panel of the menu (shown below). Select tracks by clicking the check-box
to the left of the item description. The left panel of the menu gives a number of filtering criteria to help
narrow down the track choices. For example, you may filter by experimental technique (RNA-Seq, DNA-Seq, etc.),
experimental condition (oxidative stress, pH, control, etc.), or source publication (either by first author or PubMed ID).
Select "Currently Active" under "My Tracks" to show only the tracks that are currently selected and displayed in the main window.
The "Clear All Filters" button above the right panel removes any filters applied from the left panel (but does
not de-select tracks), returning the display to all available tracks. You can also find tracks using the search
box above the right panel: for example, searching with the text "stress" shows tracks for both oxidative
stress and nitrosative stress. Clicking the "Back to Browser" button above the right panel executes any track
changes you made and returns to the main JBrowse window.
You can load your own data in GFF3, BAM, Wiggle/BigWig or VCF formats,
to display as tracks in CGD JBrowse. Data can be either in files on your local system
or from a remote web server. From the File menu in the top menu bar,
select "Open track file or URL", and add local files to the left box, or URLs to files from
web servers to the right box. Note that in order to display correctly, the data must be
annotated with the sequence coordinates of the current CGD genome version.
You can display all instances of a particular sequence or motif as a separate track.
From the File menu in the top menu bar, select
"Add sequence search track", and enter the query sequence (either plain or as regular expression).
You can search using either nucleotide or amino acid sequence, and you can search on either
or both strands.
You can combine information from separate tracks into a custom "combination" track.
For example, you may want to create a Search Track for a given sequence motif, as above,
but only display the instances that occur in genes displayed in the "Transcribed Features" track.
From the File menu in the top menu bar, select
"Add combination track". A new "empty" track is created. Click on the information labels
of the tracks you wish to combine, drag them over to the information label of the new
combination track, and release to combine (the label will appear red while you are
dragging it, and turn green when it is in position over the combination track).
After the different tracks have been added, a menu pops up to select details of the
combination (intersection, union, etc.). For the above example, you would select "Intersection".
